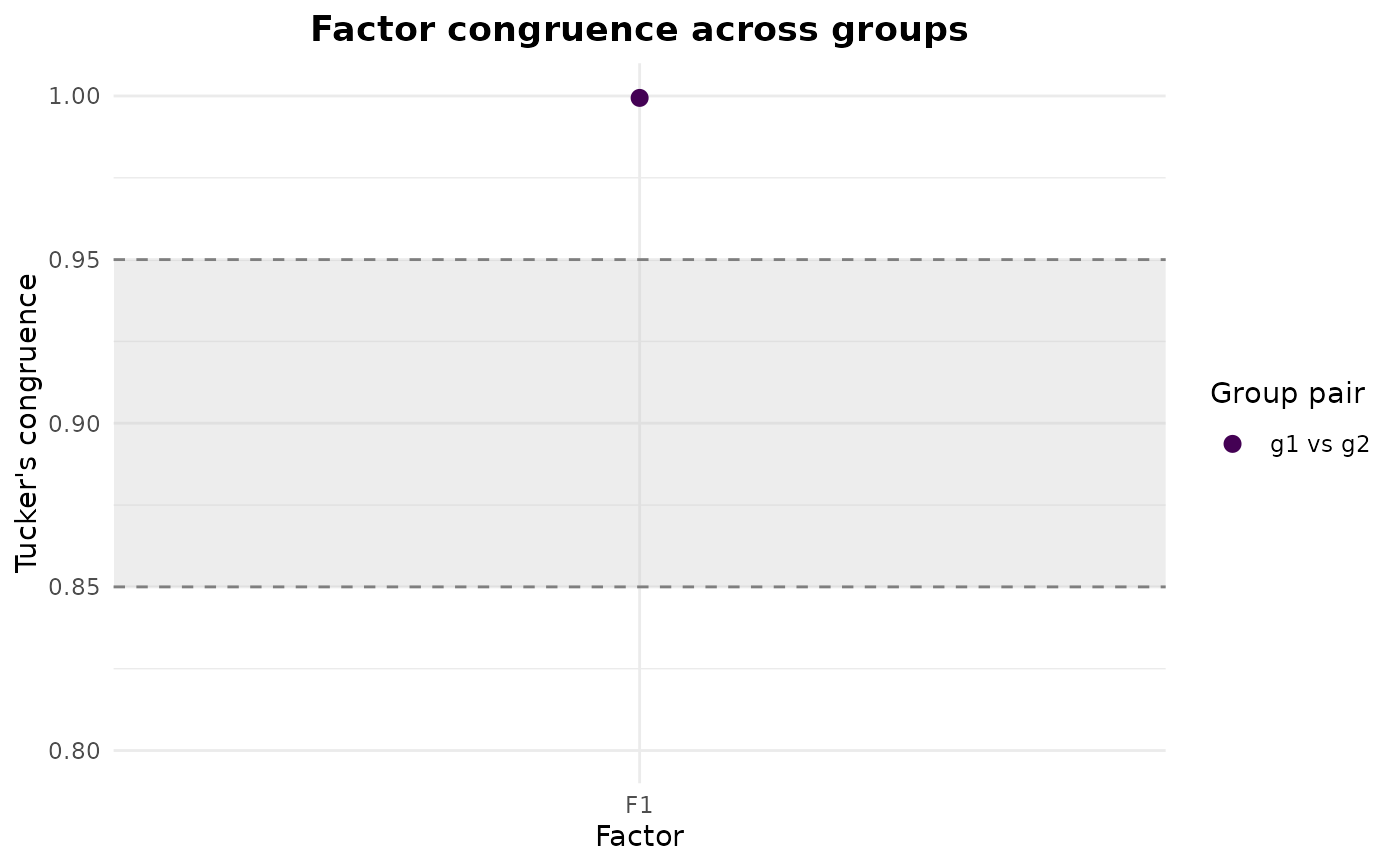
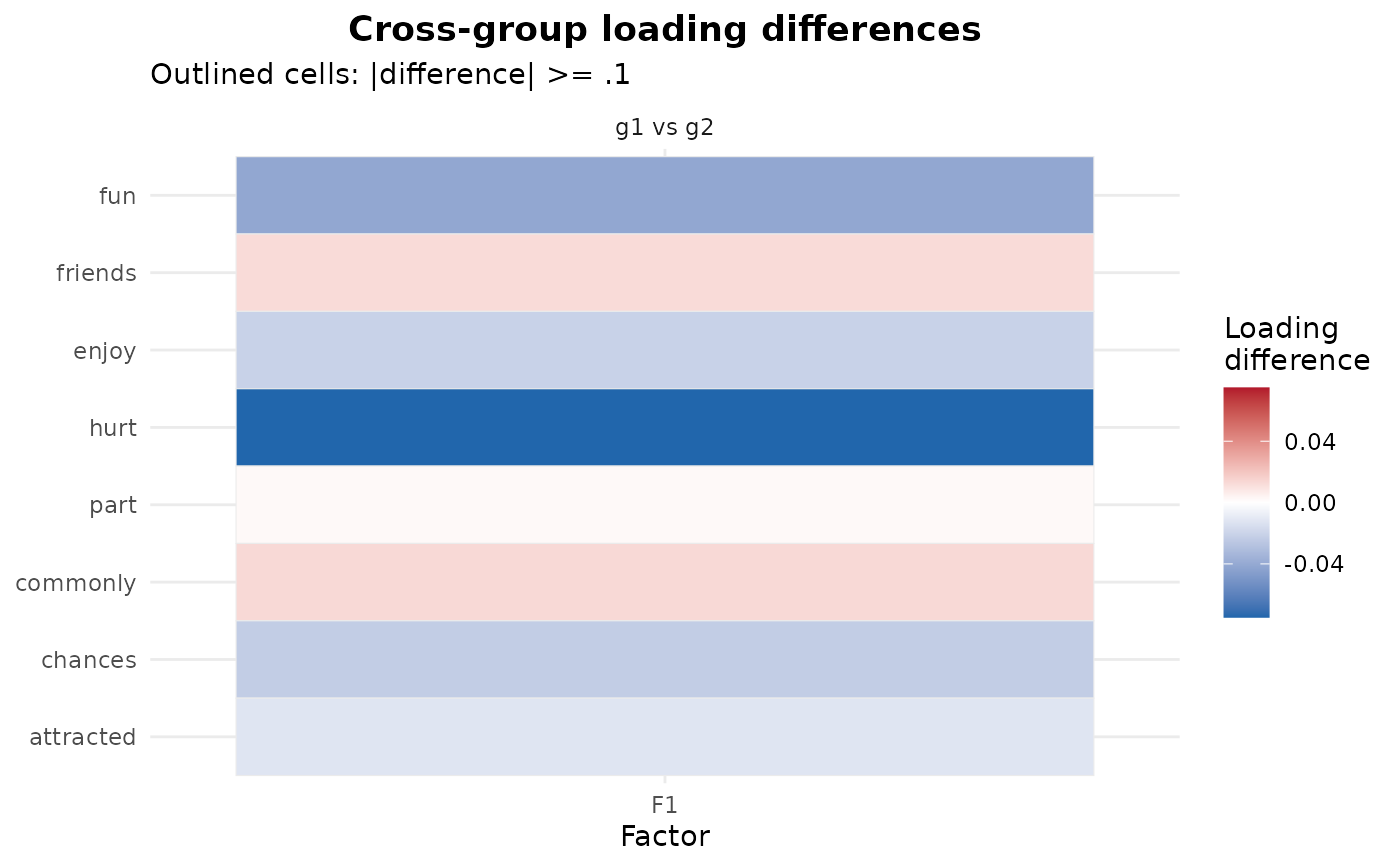
Two views of an efa_group() result, selected by type:
Arguments
- x
An object of class
efa_group(output fromefa_group()).- type
character. Which plot to draw:
"congruence"(per-factor congruence with confidence intervals) or"differences"(a per-item loading-difference heatmap).- ...
Not used; for consistency with the generic.
Value
A ggplot2::ggplot object.
Details
"congruence"(the default) plots the matched Tucker congruence of each factor between every group pair, with a percentile bootstrap confidence interval when one was computed (b_boot > 0). The Lorenzo-Seva and ten Berge (2006) reference bands (.95"equal",.85"fair") are drawn so a factor's cross-group similarity can be read against them at a glance."differences"draws a heatmap of the signed cross-group loading differences (item by factor, one panel per group pair). Cells whose absolute difference reaches the salience thresholddeltaare outlined.
References
Lorenzo-Seva, U., and ten Berge, J. M. F. (2006). Tucker's congruence coefficient as a meaningful index of factor similarity. Methodology, 2, 57-64. doi: 10.1027/1614-2241.2.2.57
See also
Other factor analysis:
efa_average(),
efa_fit(),
efa_group(),
efa_mi(),
print.efa_group()