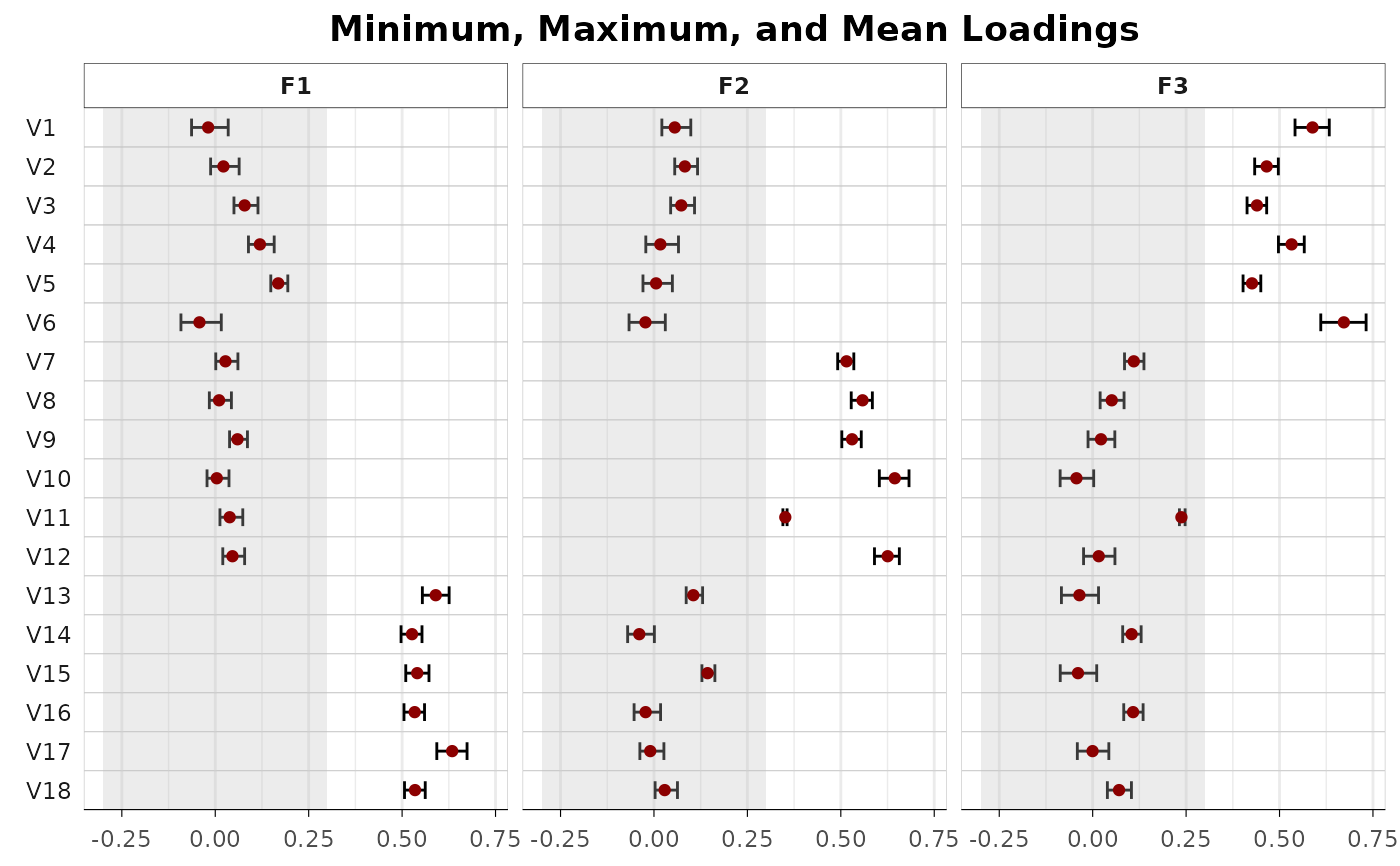
Plot method showing a summarized output of the efa_average() function
Usage
# S3 method for class 'efa_average'
plot(x, ...)
Arguments
- x
list. An output from the
efa_average()function.- ...
not used.
Value
A ggplot object showing, for each indicator and factor, the minimum, maximum, and average (mean or median) loading across the averaged solutions. Each panel carries a point at the average, a bar spanning the minimum to the maximum with a tick at each endpoint, and a grey band marking the loadings that fall below the salience threshold; the caption names the four marks.
Examples
# \donttest{
EFA_aver <- efa_average(test_models$baseline$cormat, n_factors = 3, N = 500)
#> ℹ Extracting data
#> ✔ Extracting data [13ms]
#>
#> ℹ Reordering factors
#> ✔ Reordering factors [23ms]
#>
#> ℹ Averaging data
#> ✔ Averaging data [20ms]
#>
plot(EFA_aver)
 # }
# }